
The Moving Average (MA), in all its various forms, is one of the most commonly used and best known indicator in technical analysis. There are countless ways to use it, in a variety of trading strategies and tactics. This category is not to rehash all the various common ways to use MAs or to talk about the numerous strengths and weaknesses of each approach. There are many and I would suggest doing your own homework on the various types and usages of MAs if it so interests you.
This section of our blog is to demonstrate a brand new novel approach to using this powerful indicator. Moving averages are by definition, a lagging indicator. That doesn’t mean they are not without important value, they are, when used appropriately. For us, we base all of our trading decisions on ‘price action’ based tactics and strategies. We typically use MAs as support and resistance levels and then search for patterns that give us high predictable outcomes that we can trade from.
Fun with Moving Averages is our newest trading strategy, which grew directly out of our most powerful and effective strategy to date, the Spotlight Power Trader.
The way it works is like this:
- We identify exhaustion zones on a chart where one side (buyers or sellers) runs out of gas; gets tired and exhausted (thus, exhaustion zones)
- We identify the great ‘crocodile pit,’ that line in the sand that marks the balance of power point, between buyers and sellers. This is a dynamic moving line that changes from price bar to price bar. Suffice it to say that there IS a balance of power point on every price bar, on every chart regardless of the symbol or market. It always exists!
- We use certain moving averages that line up with our exhaustion zones to identify significant support and resistance levels
- We use the right amount of confirming information which in turn stacks the odds heavily in our favor
- Price action itself is part of the confirmation process
- From these building blocks we look for specific patterns that predict high percentage outcomes that we place trades from.
- The immediate past predicts the immediate future. This concept works on all time frames but we focus on the sweet spot charts that are proven to work consistently. We don’t try to trade every market move. We wait for the patterns where we can control the odds.
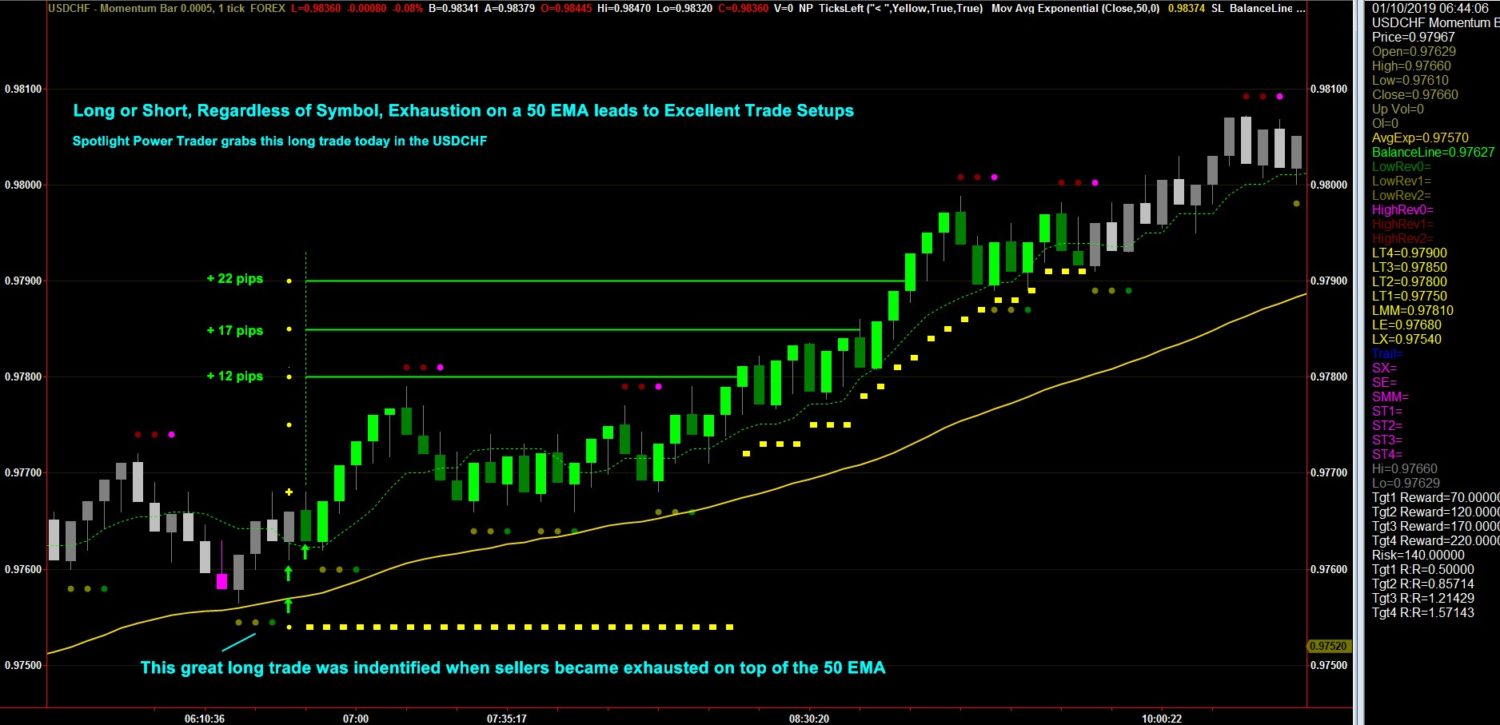
The story of how this unique approach to trading with moving averages came about is a long and winding one, evolving out of the learning experiences from each of the most successful strategies that I have created. The first Fun with Moving Averages trade setup presented itself to me while trading with one of my earlier and wildly successful strategies, the Counter Punch Trader. I had noticed that when our ‘exhaustion indicator’ had appeared within close proximity of a 50 EMA (exponential moving average), the trade that followed had a very high win rate. I continued to research this further and over time, this unique trade setup became the trade that gave birth to the Spotlight Power Trader.
The buyers get exhausted right at the 50 ema, which sets up this highly effective short setup in the Russell eMini. But it doesn’t really matter what market or symbol it is.
Here is a long example of a Forex Daytrade chart, where the sellers get exhausted right at the 50 ema.
We’ll be exploring more of these setups along with brand new, never seen before setups as we continue to have Fun with Moving Averages. Check back often.
[fusion_button link=”https://www.netpickstrading.com/watchnow” text_transform=”none” title=”” target=”_self” link_attributes=”” alignment=”center” modal=”” hide_on_mobile=”small-visibility,medium-visibility,large-visibility” class=”” id=”” color=”custom” button_gradient_top_color=”#000e7a” button_gradient_bottom_color=”#000e7a” button_gradient_top_color_hover=”#4a8ece” button_gradient_bottom_color_hover=”#4a8ece” accent_color=”” accent_hover_color=”” type=”flat” bevel_color=”” border_width=”” size=”medium” stretch=”default” shape=”round” icon=”fa-arrow-alt-circle-right far” icon_position=”left” icon_divider=”no” animation_type=”” animation_direction=”left” animation_speed=”0.3″ animation_offset=””]FREE Webinar: Small Accounts BIG Profits![/fusion_button]
Comments
2 responses to “Fun with Moving Averages”
Great job Troy.
I just joined after the presentation from Wealth365.
I’m in with your program, etc. and will be in long.term.
Sincerely
Scott
Hi Scott, thanks for the vote of confidence. We really appreciate it! Sorry for the lateness in responding to you. This is a brand new blog and just getting things setup.